Lecture notes - Belépés
11. Large scale maps and plans
definition of scale
slope, ground (horizontal), geodetic and grid distance
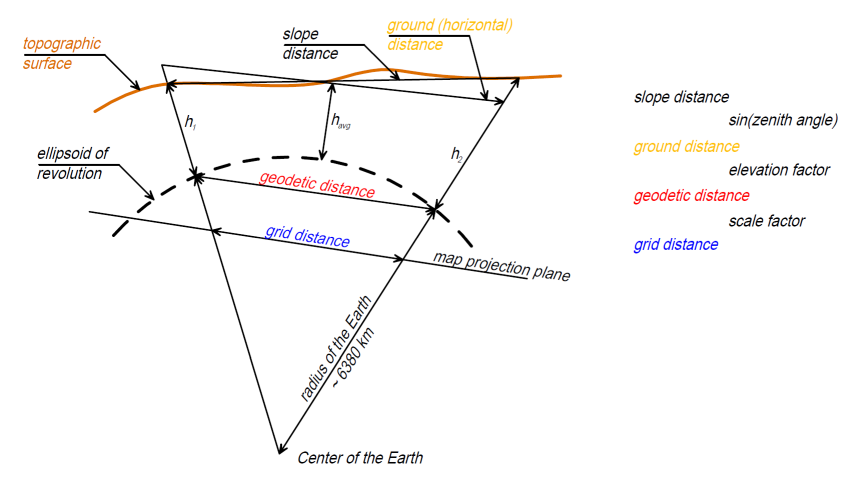
The definition is the ratio of a distance on the map to the corresponding distance on the map projection plane (and not to the distance on the ground).
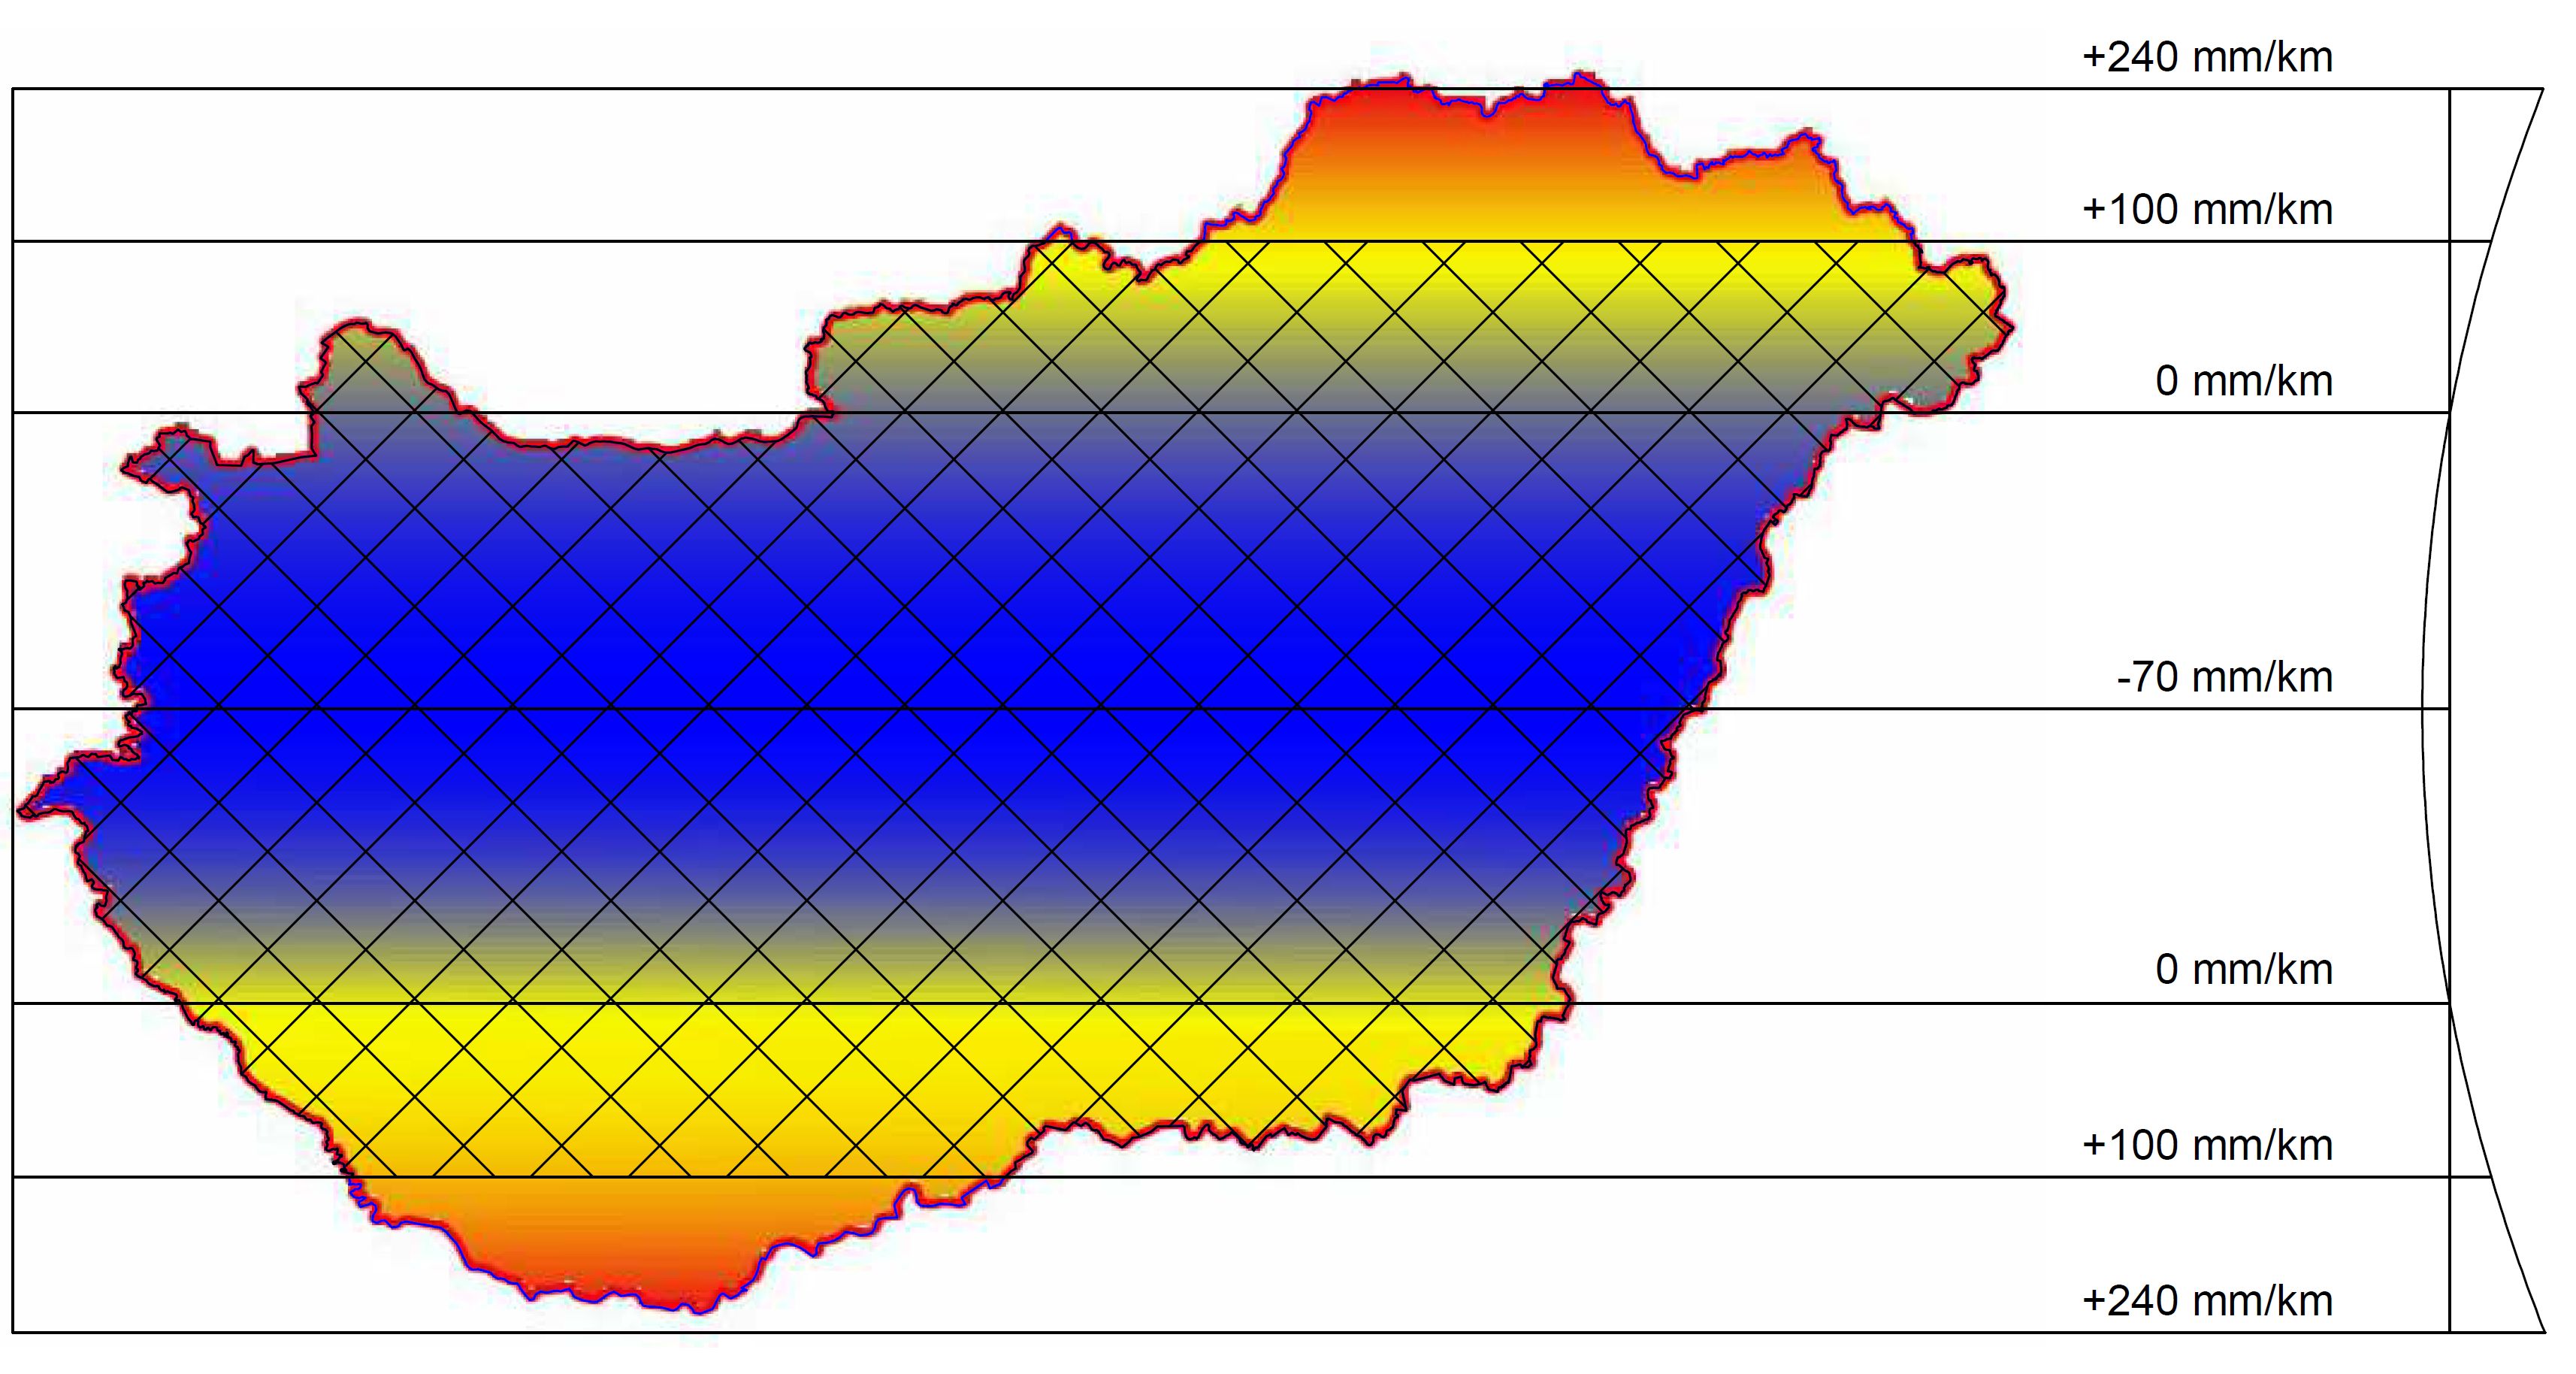
scale factor in the Hungarian EOV map projection
classification by scale
- large scale 1:50 - 1:50000
- medium scale 1:50000 - 1:200000
- small scale 1:200000 -
different types of maps and typical scales (in Hungary)
- maps for design: 1:200, 1:500, 1:1000
- land registry map, cadastral map: 1:1000, 1:2000, 1:4000
- public utility maps: 1:500
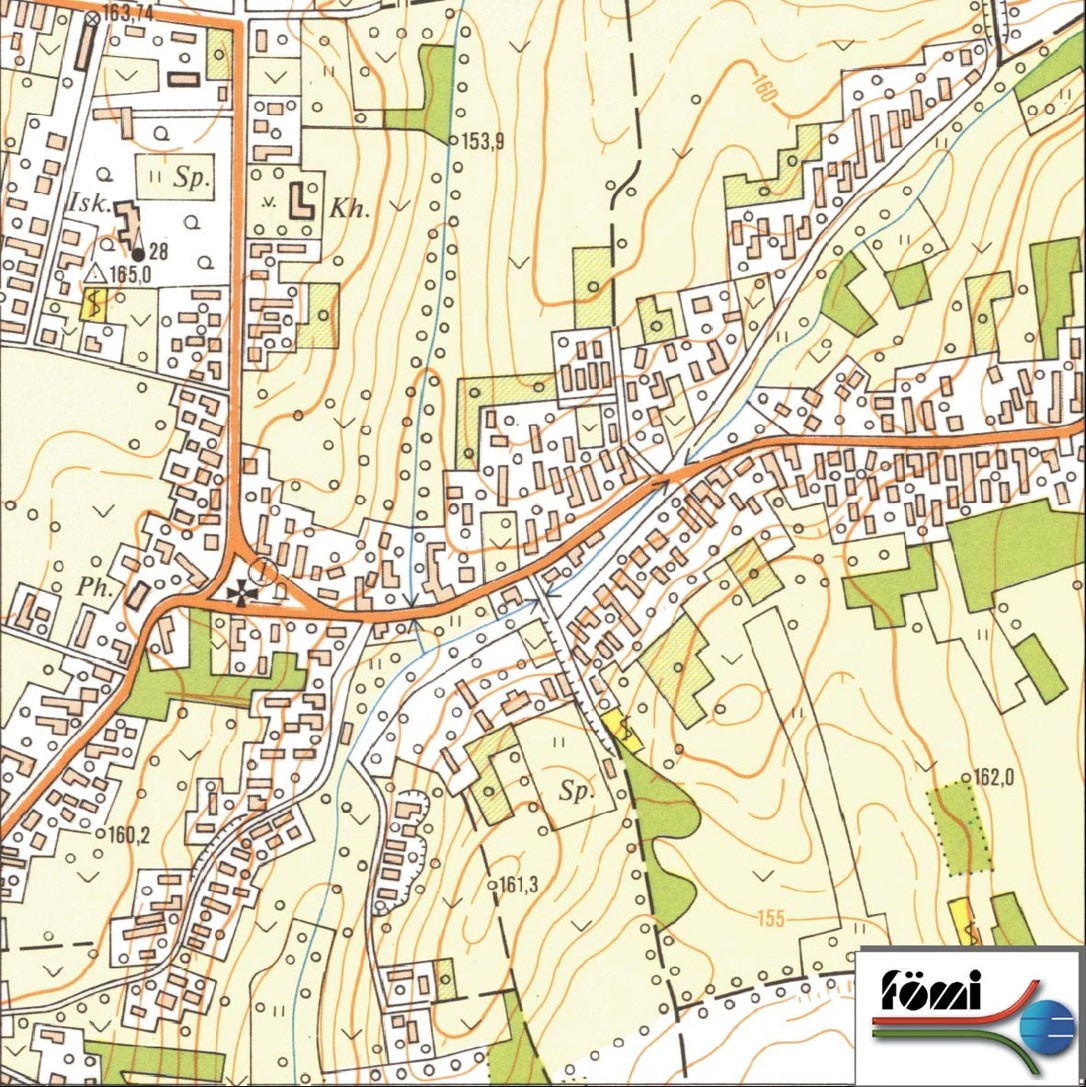
- topographic map: 1:10000, 1:25000, 1:50000
Examples:
- https://minerva.bp12ker.hu/minerva/bp12ker/internet.php - online geoinformatics system of Budapest 12 district
- https://www.e-epites.hu/e-kozmu - online public utility map
- topographic map:
Which scale should I use? It depends on the purpose of surveying project and the size of the area to survey.
Does a digital map have a scale?
- No, because you can print the digital map on any scale
- Yes, because there is a strong relationship between the accuracy of the map and its scale.
- Yes, because there is a strong relationship between the details you want to show on your map and its scale.
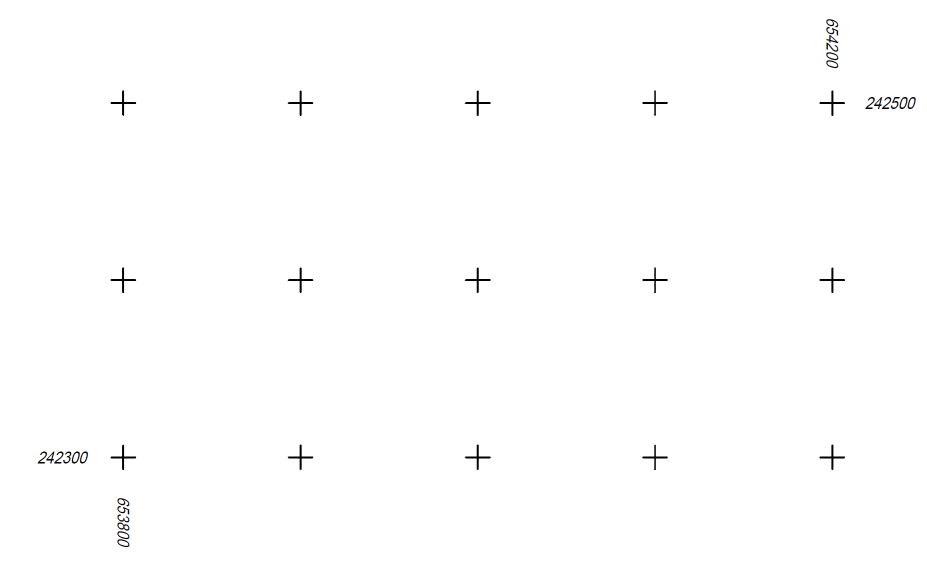
The grid on a map
Horizontal and vertical lines or intersections, their distance is normally 100.0 mm on the map. In the engineering practice, they have round coordinates, which are labelled. Grid points help to keep and determine the original scale of paper-based maps. A long time ago they were also used to measure coordinates of specific points on the map or add new points by their coordinates. Even at the present times, grids are used when printing out digital maps in order to help localization, orientation and they keep the original scale as well as the coordinate system.
Developing a digital map:
An example of a large scale map- land registry map as a base map.
- import measured points. The result of detail surveying is typically a list of coordinates. Point ids, codes, elevation or other important features are labelled. Most of the cases three-dimensional coordinates are used.
- drawing (editing) the map. Connect the points with lines according to the codes or information recorded on the sketch. Have different layers with easy-to-understand layer names. Don't forget the intersections in 3d.
- tuning the map with texts, symbols, different line types, line weights. Use different colours. Visualization of terrain. Legend, additional information. Prepare the drawing for printing. A pdf version is also required.
Symbols
Requirements of symbols
- easy to understand the map
- standardization
- make small things visible
- do not hide other important features
- provide clear information about the position of the feature
- easy to draw
Visualization of the terrain:
- contour lines
- spot heights
Which method do I use? Pros and cons of the two methods.